The PC Pitstop Windows PC form factor chart shows that the overall percentage of folks using portable PCs reached the 50% mark during August 2014. The portable percentage has grown at a very gradual but consistent rate over the years.
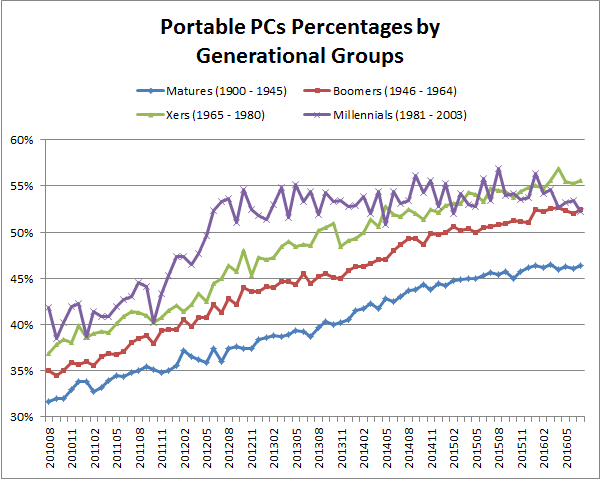
The chart below shows the portable PC usage rate by generational groups.
The data for this report comes primarily from our customers running the PC Matic scans for their PC systems each month. (Note: The erraticness of the Millennial generation plot line is likely the result of the smaller sample size of that group in our customer base.) While all groups have seen a portable form factor increase over the years, the older generations lag in their respective usage of portable PCs.
As a member of the “older generation”, this author doesn’t find it too surprising. Usage habits and possibly some resistance to change likely play a role in the explanation of these results.


