Virus Bulletin RAP Test: PC Matic Blows Away Competition (Again)

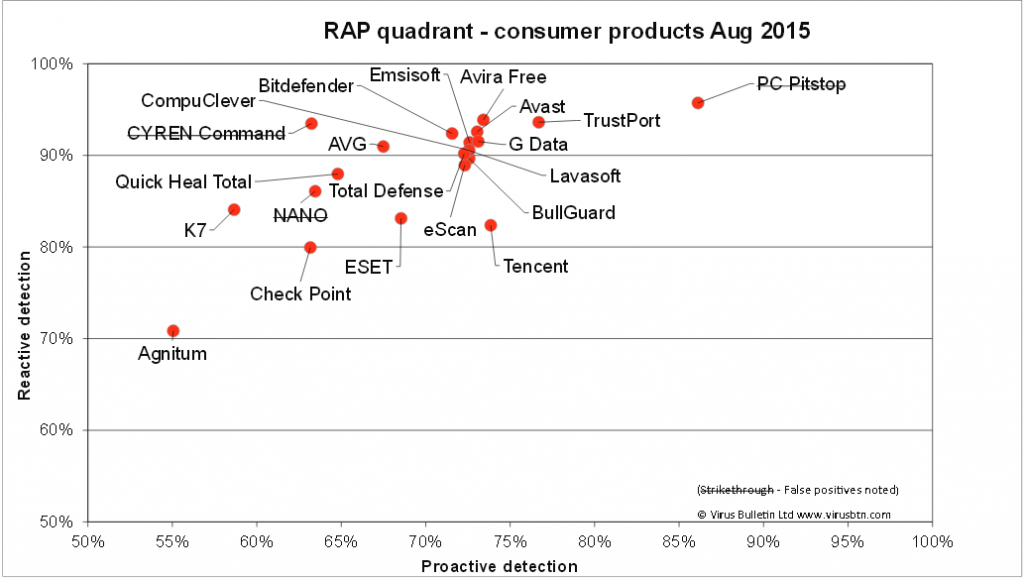
PC Pitstop is thrilled to announce that PC Matic, once again has blown away the competition in the well respected Virus Bulletin RAP Test. This test looks at each software’s ability to detect millions of malicious files both at a proactive and reactive level. The malware samples are updated each time the test is conducted, ensuring these programs are being tested with the most current listing of emerging malware possible. The results report PC Matic ranked first in both proactive and reactive approaches, scoring a cumulative average of 92.5%, with the closest competition being a full 4.5% behind PC Matic with a cumulative score of 88%. This provides unbiased, third party evidence that our whitelisting method provides superior results when it comes to preventing and reacting to PC security issues, compared to our competitors’ blacklisting and heuristic approaches.
Virus Bulletin Touts ‘Impressive Detection Rates’ of PC Matic Whitelisting
Specifically, Virus Bulletin praised PC Matic’s whitelisting approach for offering “impressive detection rates”. PC Matic has been utilizing the whitelist approach since January of 2011. Whitelisting involves the creation of a list of programs and files that are known to be safe and virus-free, unlike blacklisting which simply is a list of known malicious viruses, malware, etc. The issues blacklisting creates is, by changing one component, the malicious file can be slightly modified and is no longer detected by the blacklist, thus leaving an open door to your PC for attack. These issues are virtually nonexistent when dealing with a whitelist approach, as PC Matic’s whitelist is a consistently updated list of tested, malicious-free programs and files.
The security industry, including the testing houses such as Virus Bulletin, place a higher value on not blocking good files (false positives) than accurately identifying bad files (false negatives). In the Virus Bulletin methodology, there is zero tolerance for false positives. If a product has one false positive out of a million, then the product fails VB100 certification. On the other hand, the exact same product can misidentify hundreds if not thousands of bad files as good with little consequence on ratings and certification. The most recent Virus Bulletin testing included approximately one million good files, and PC Matic incorrectly identified less than a thousand. This represents a .1% error rate or 99.9% whitelist accuracy rate.
In the event of a false positive, PC Matic minimizes the customer impact. The good process is not allowed to run, but it is not erased from the hard drive. The process is sent to our research team to be re-categorized within 24 hours. Although this may provide a minor inconvenience, it is considered minimal when compared to allowing a potentially malicious file into the PC for corruption.
With the improvements that PC Matic has implemented since the July 2015 testing, there will surely be an even larger gap between PC Matic’s security software and that of the competitors when the October 2015 results are released. Until then, we anxiously await!
Below is a graph of all of PC Matic’s historic Virus Bulletin test results. By clicking on the graphed plots, you will be directed to each individual report. The reports are also available via the table below, by clicking on the month/year to access the full report. The table also shows the exact RAP score for each test.
PC Matic Historic Virus Bulletin RAP Test Results
| Date of Test | RAP Score | RAP Average | RAP High | RAP Low | PC Matic Proactive Score | RAP Proactive Average |
|---|---|---|---|---|---|---|
| April 2014 | 95.80 | 87.70 | 95.80 | 66.20 | 92.00 | 78.92 |
| August 2014 | 95.98 | 90.88 | 98.20 | 40.80 | 89.60 | 80.55 |
| December 2014 | 86.89 | 82.43 | 91.63 | 22.50 | 72.28 | 69.72 |
| April 2015 | 92.79 | 83.23 | 94.79 | 14.84 | 87.49 | 76.85 |
| August 2015 | 92.52 | 75.56 | 92.52 | 25.10 | 86.10 | 65.72 |
| October 2015 | 90.71 | 87.31 | 95.95 | 64.3 | 86.47 | 78.56 |
| December 2015 | 93.42 | 84.99 | 93.50 | 67.70 | 89.80 | 70.57 |
| April 2016 | 87.07 | 77.90 | 87.40 | 31.50 | 87.70 | 63.94 |
| August 2016 | 99.90 | 81.03 | 99.90 | 41.90 | 99.90 | 66.60 |
| December 2016 | 99.90 | 82.66 | 99.90 | 63.3 | 99.90 | 64.35 |


